

Queryable evidence for every LLM call: for debugging and for compliance.
When a call goes wrong in production (runaway cost, a leaked secret, a hallucinated answer) you need the full story of that request. Most LLM stacks throw it away.
How FortifyRoot solves it
Every call, fully traced
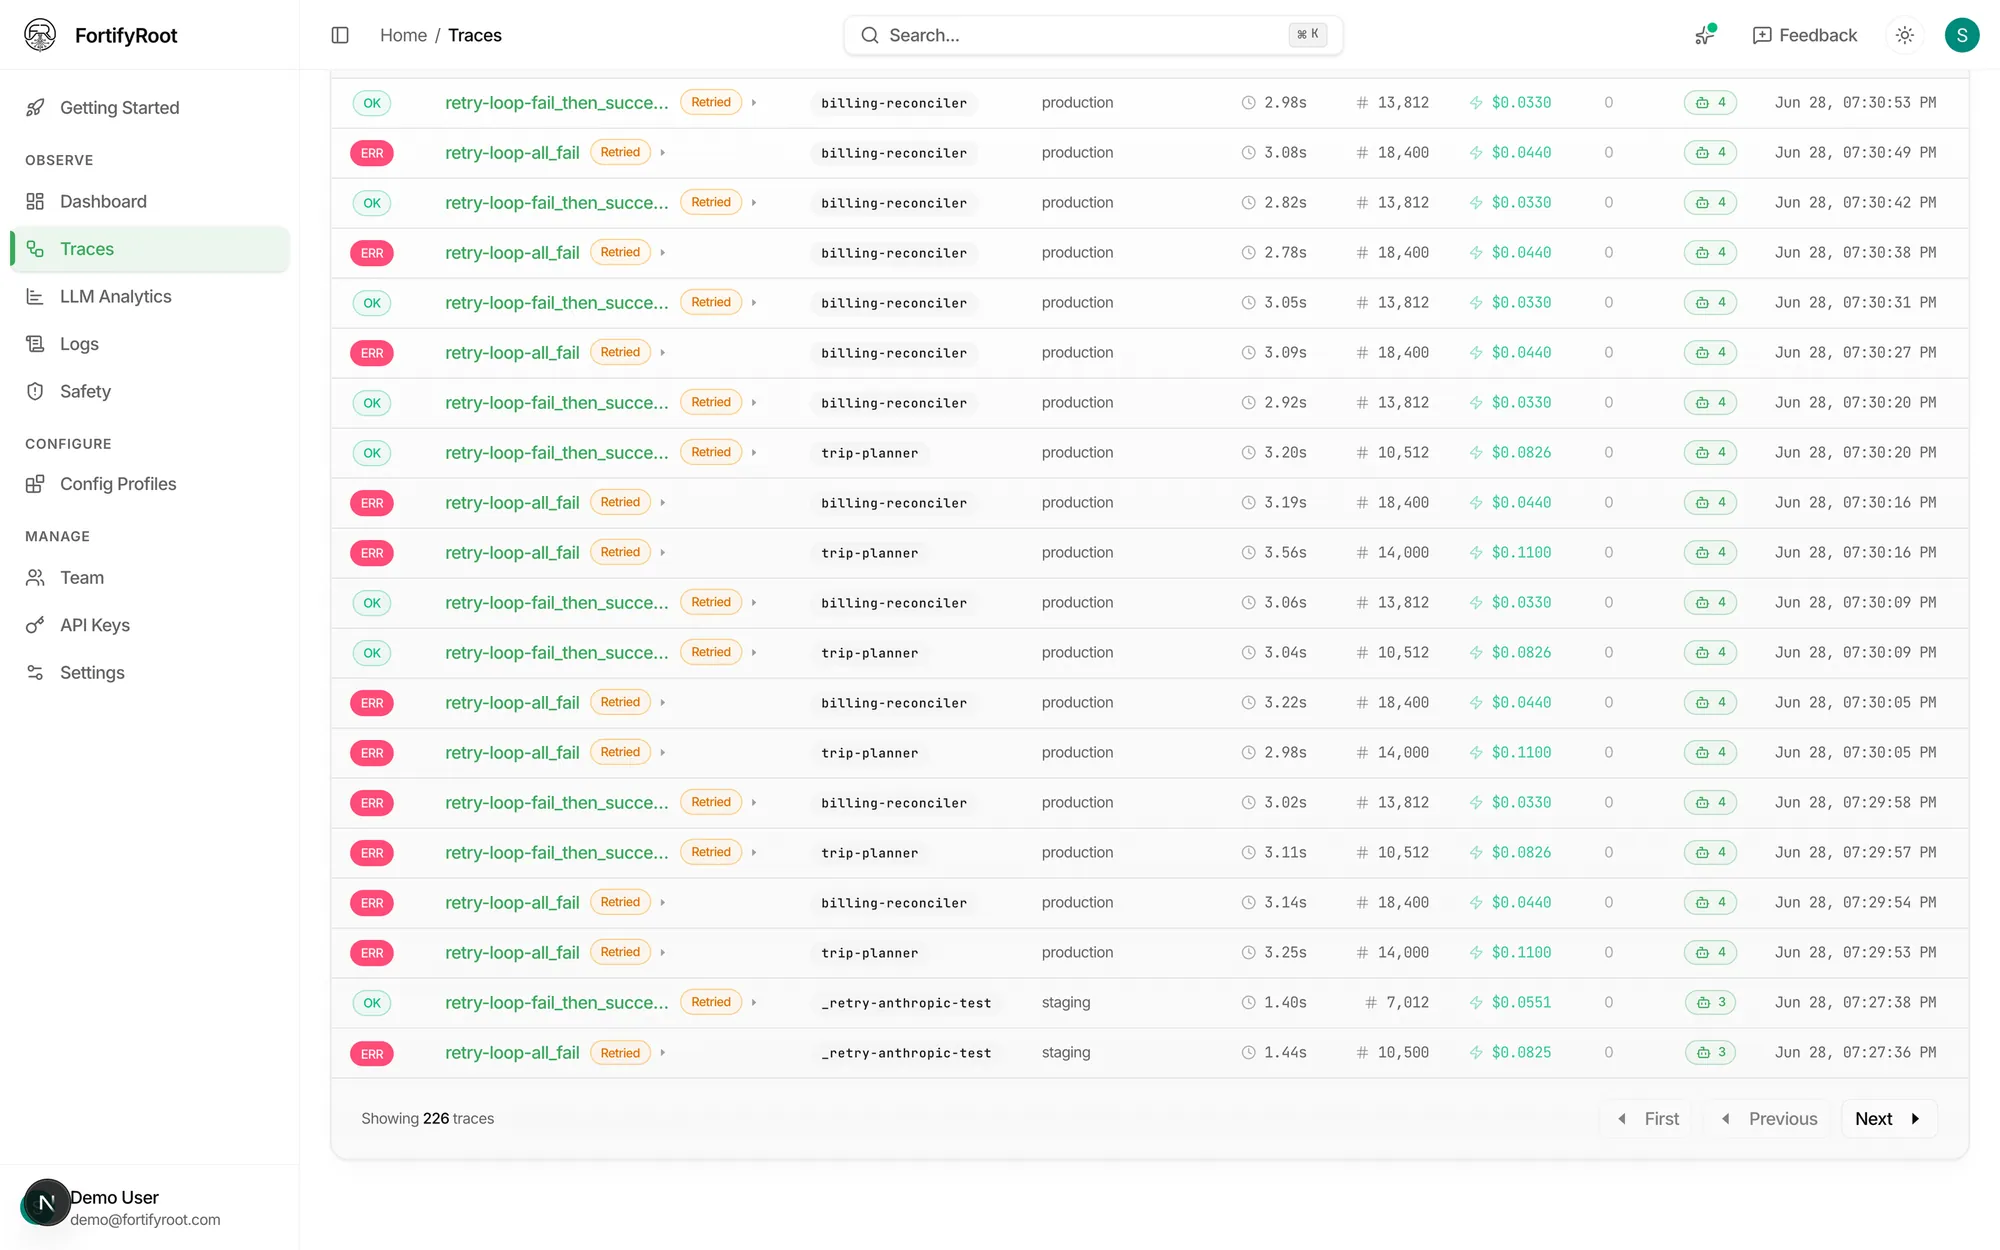
Request- and operation-level OpenTelemetry spans for every LLM call, with status, error signal, and cost and token aggregates on the trace summary.
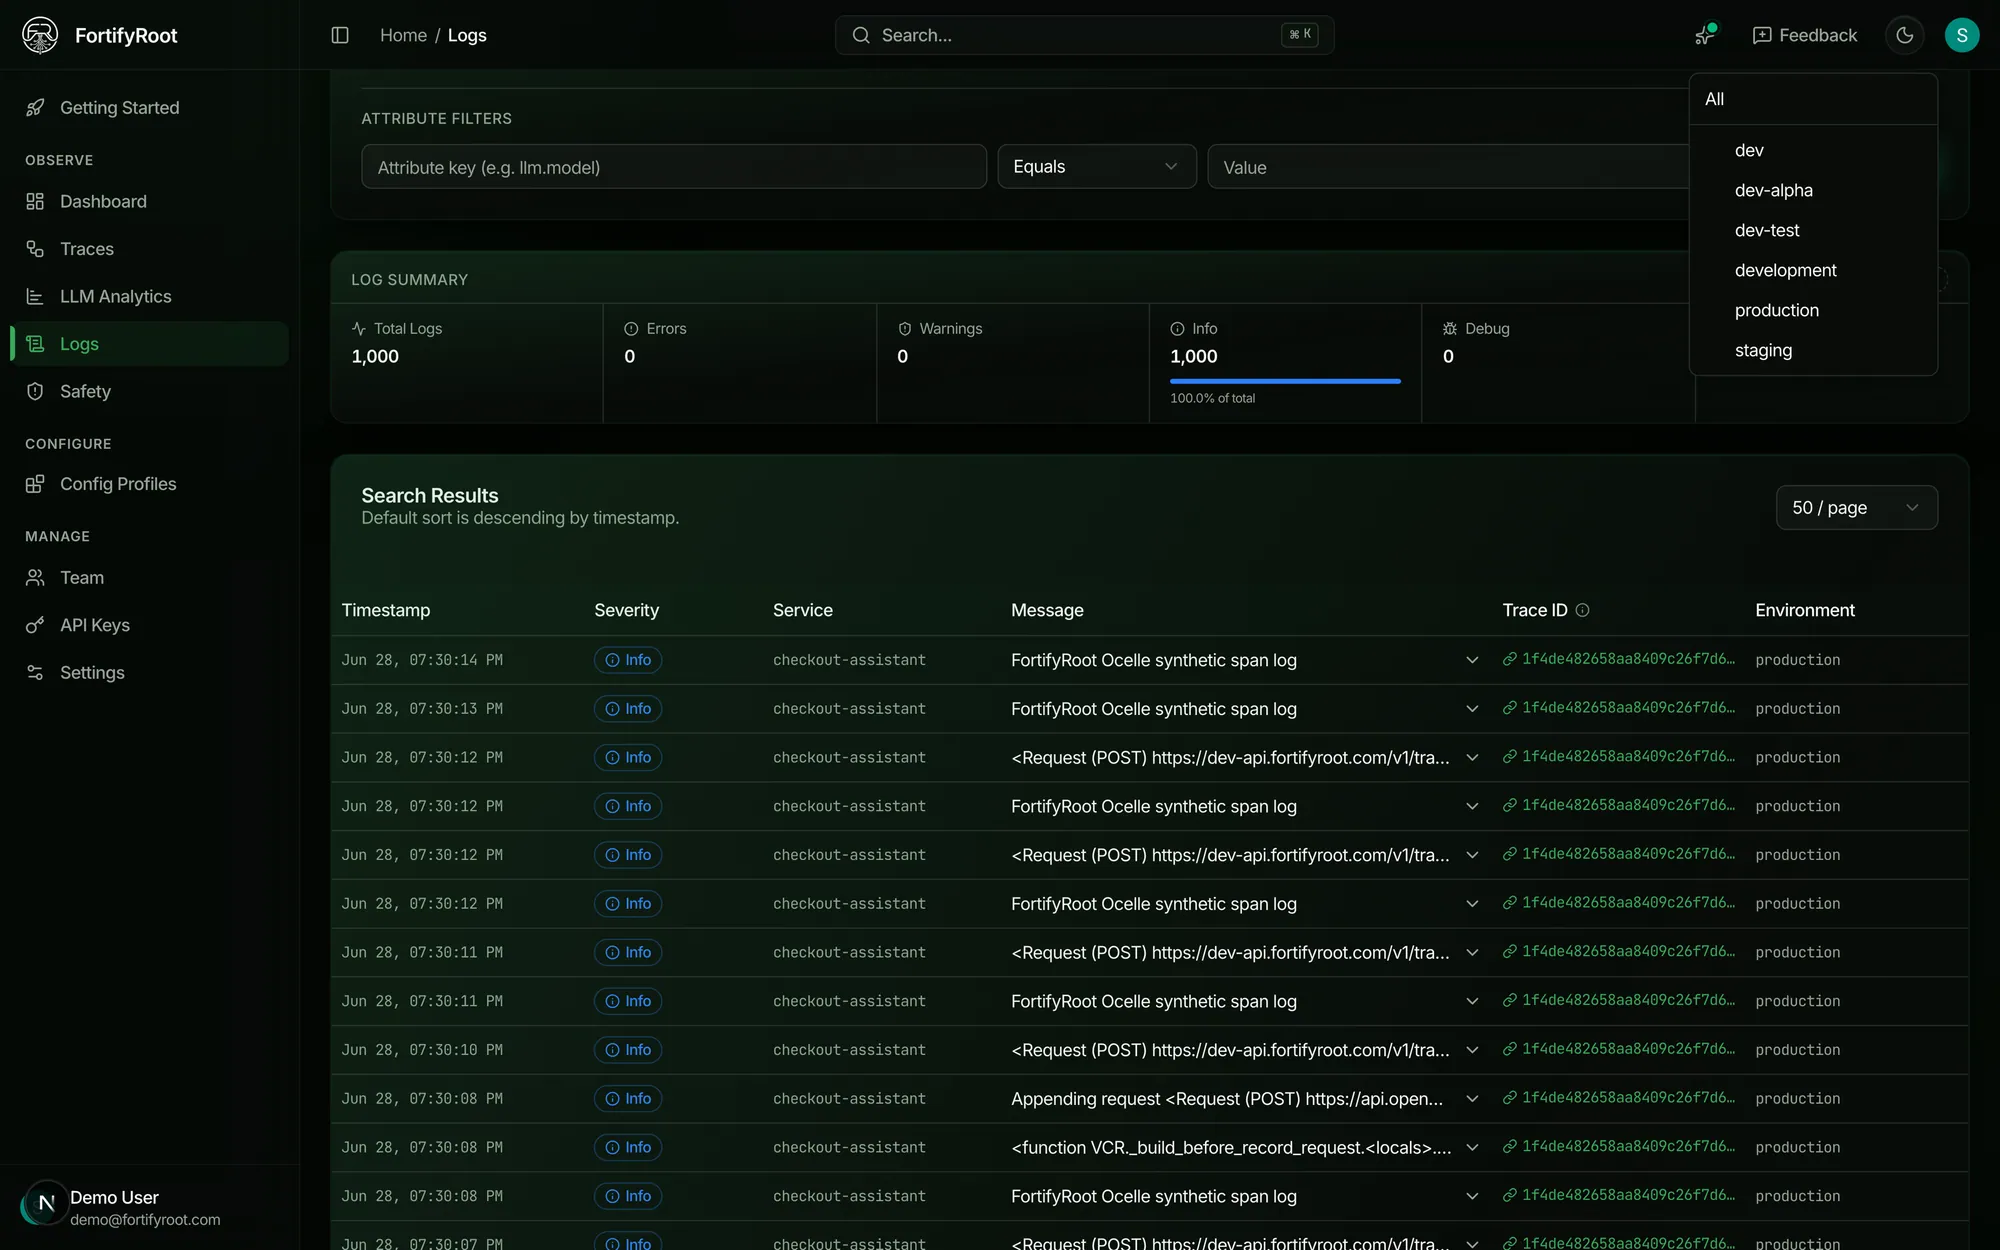
Logs correlated to traces
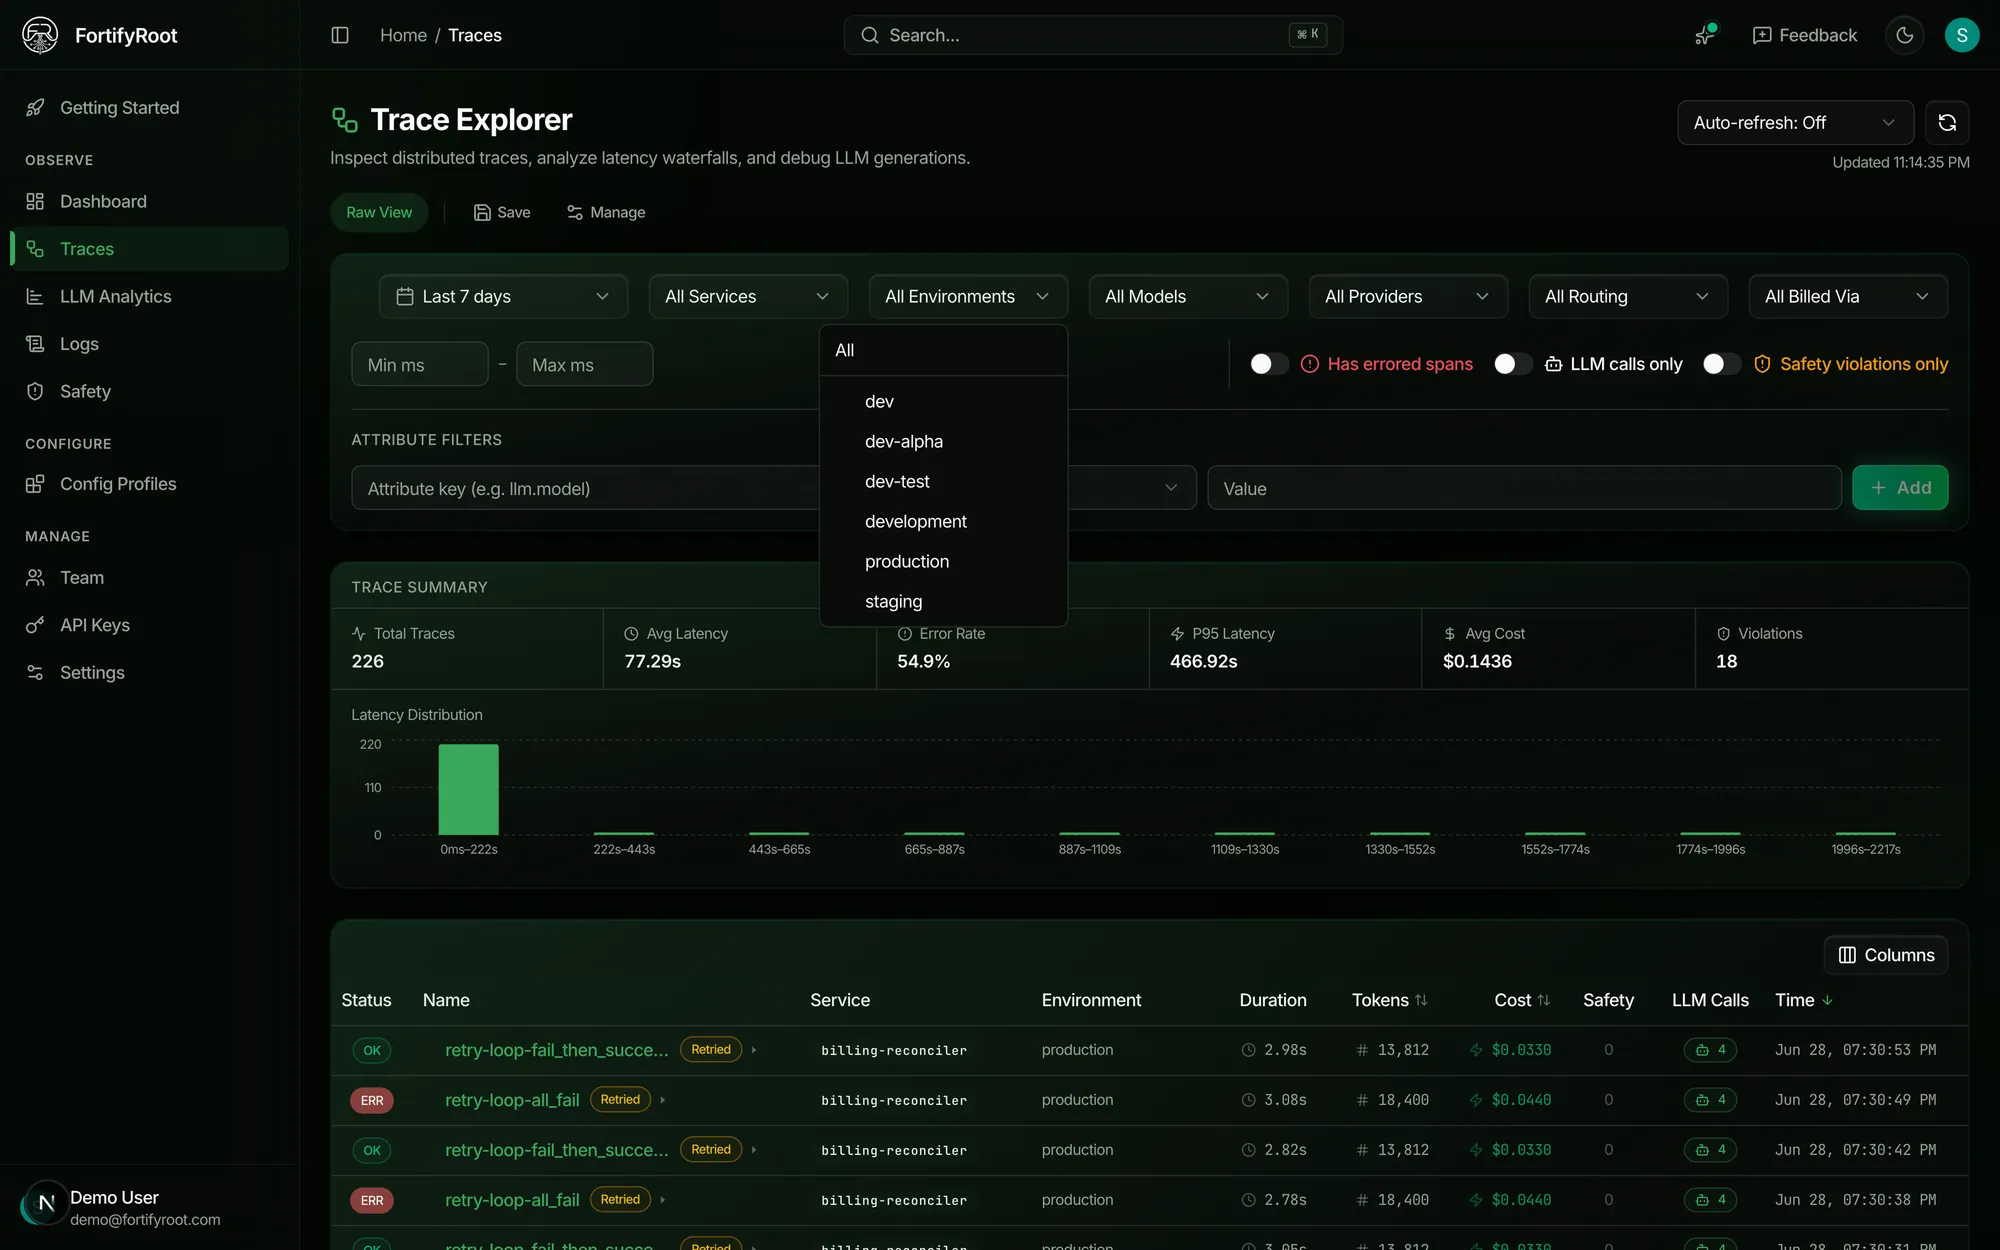
Application logs exported through the SDK are correlated to the trace and span that emitted them, so debugging a bad answer starts from the call, not a log search.
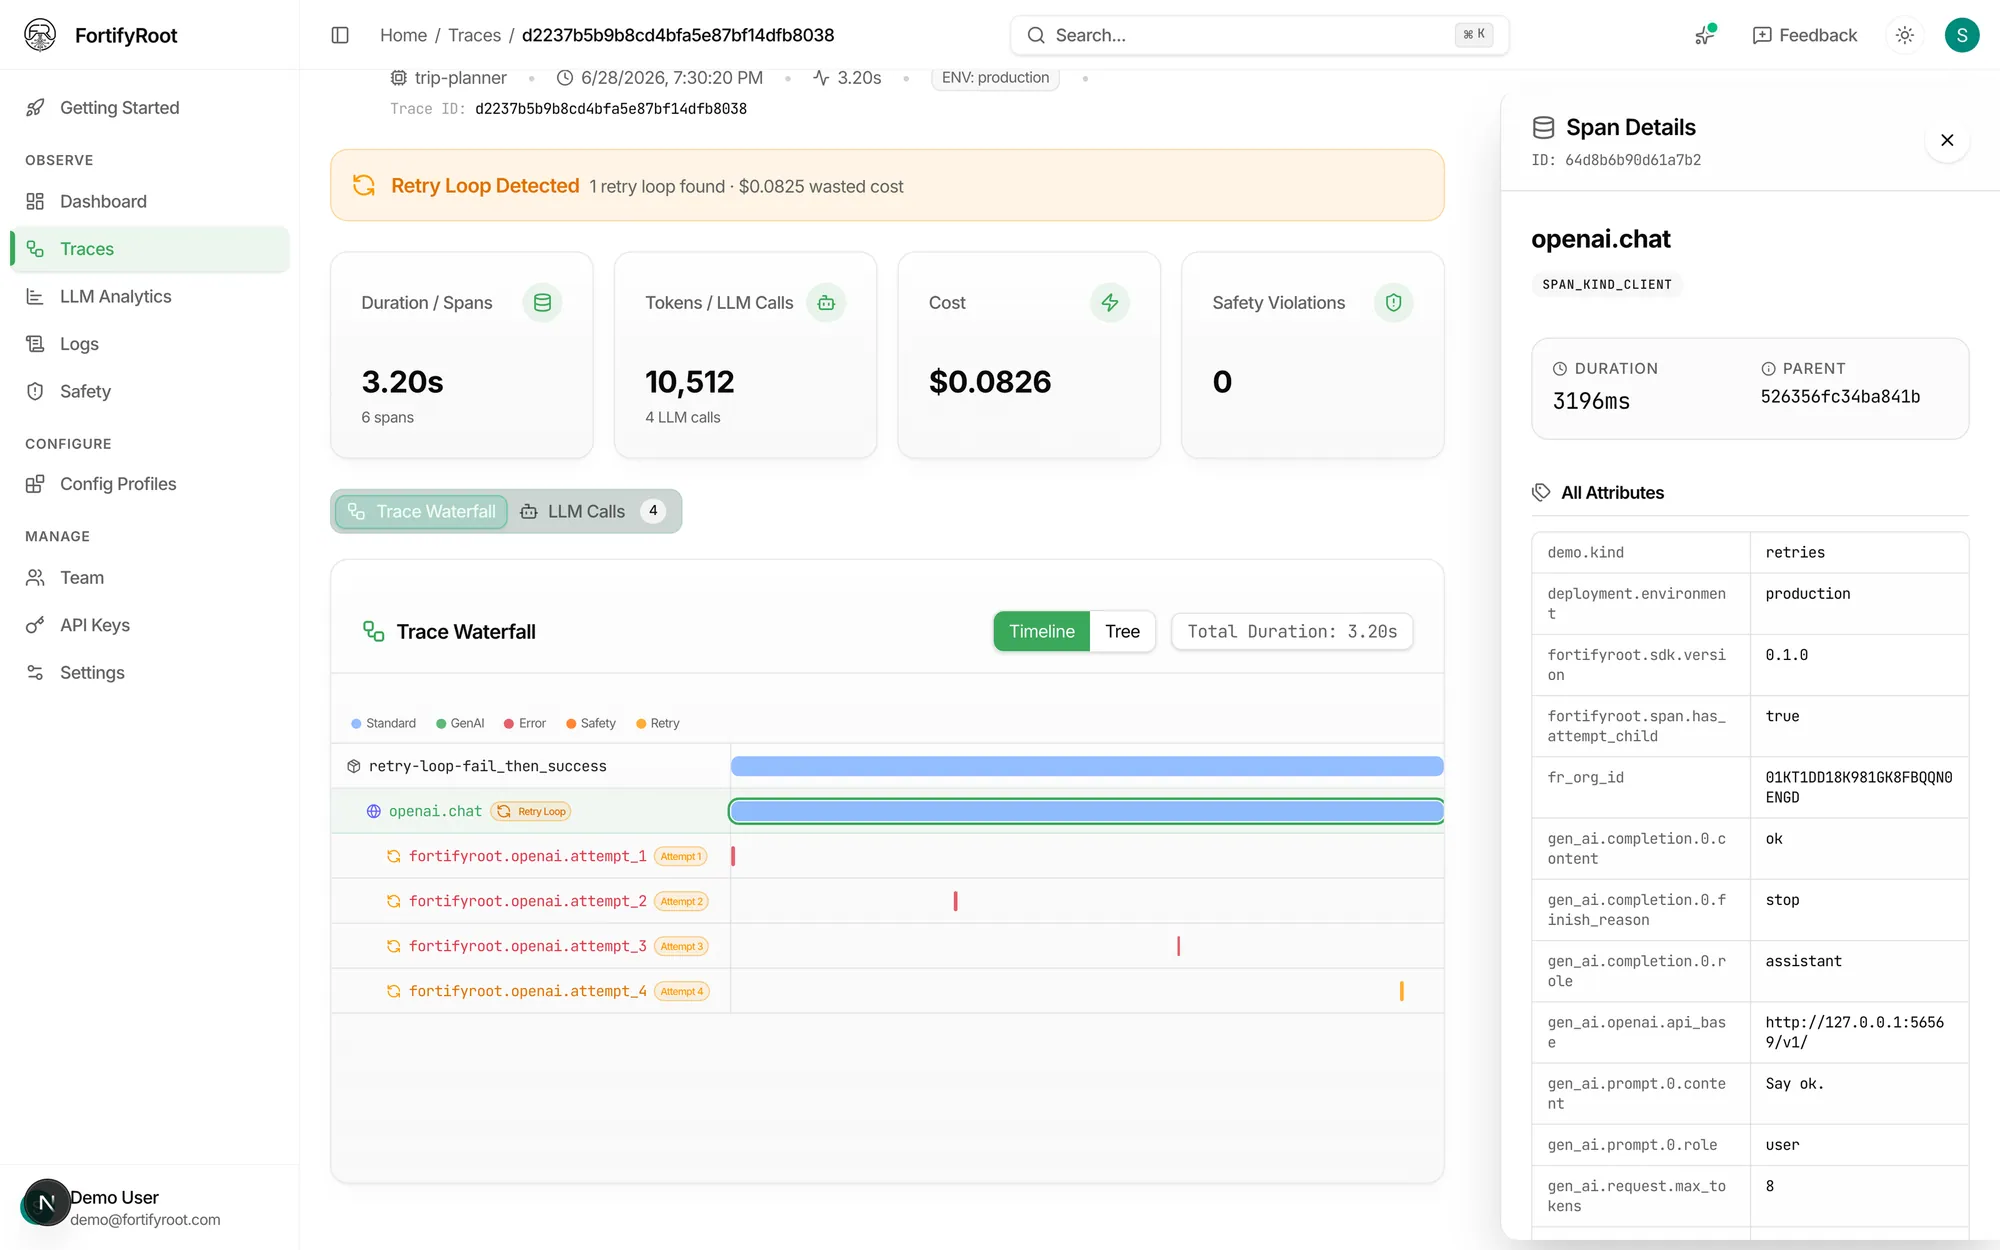
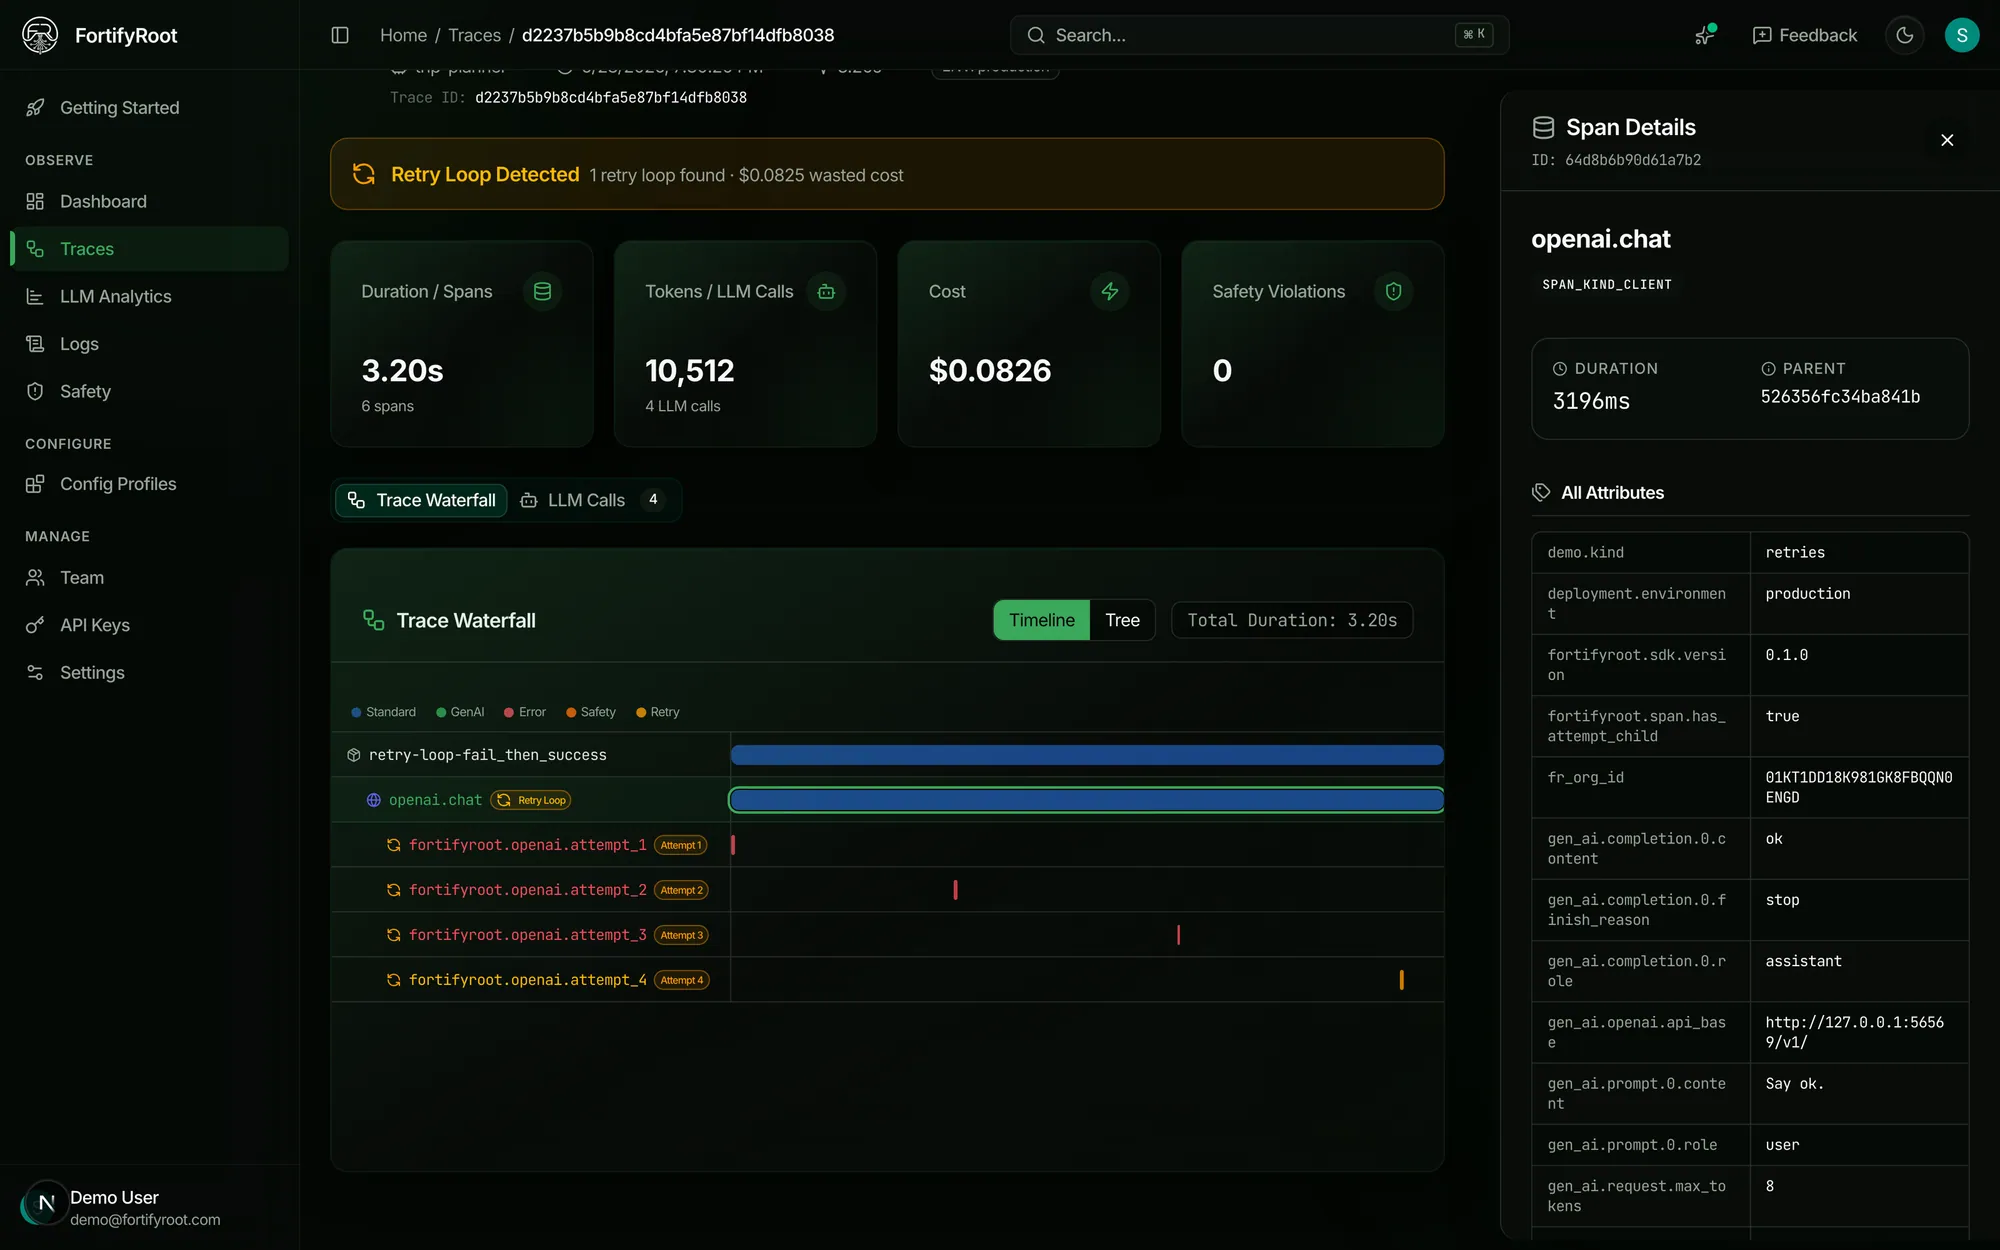
Retry loops, span by span
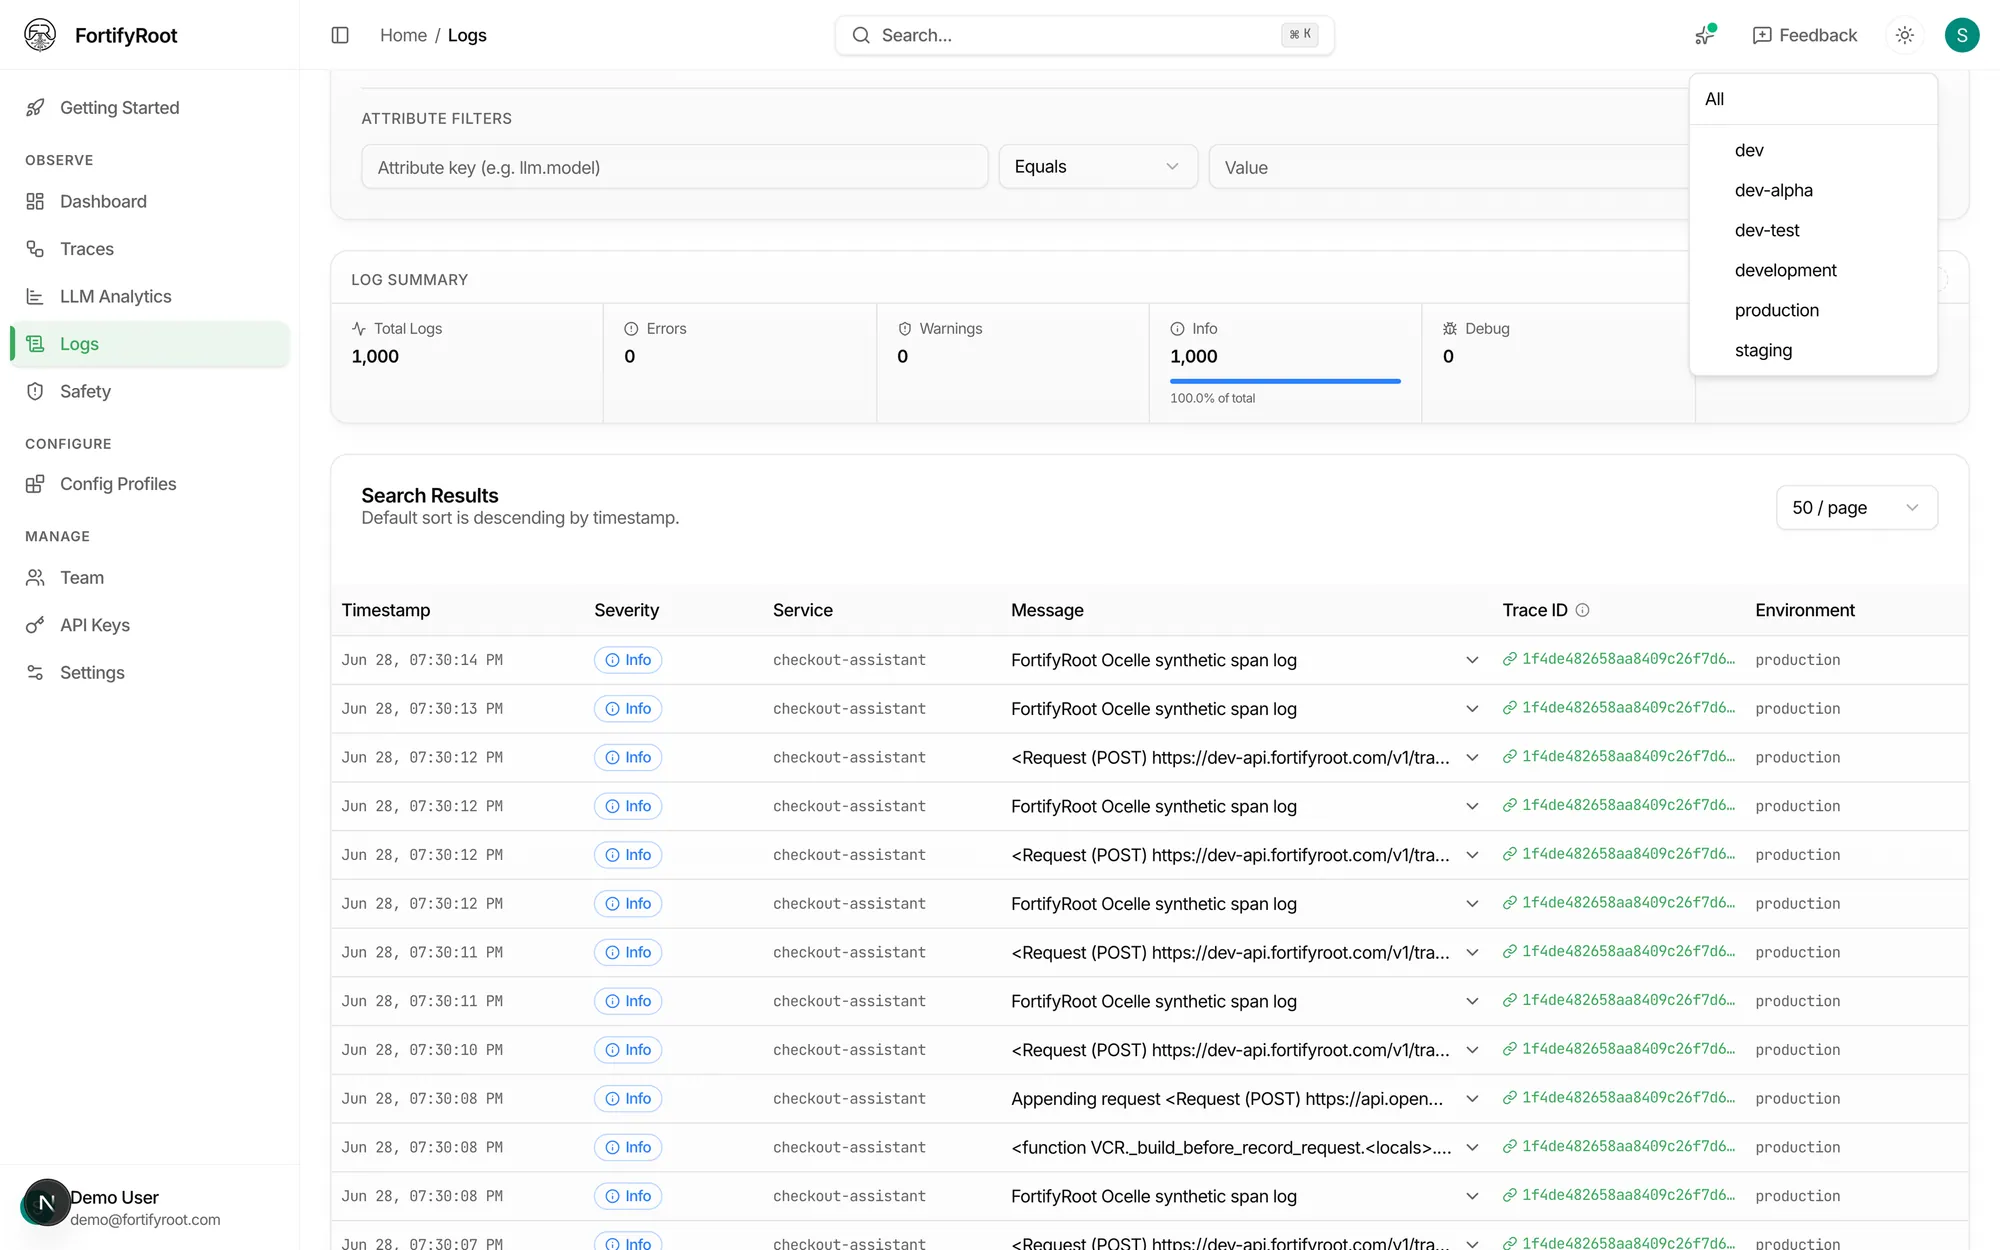
When a provider-SDK retry chain fires, every attempt is captured as its own span: see exactly where the loop happened and what it cost.
Instrument it in two lines
Initialize Ocelle once; keep calling your providers as normal.
import fortifyroot.ocelle as ocelle

# Before running: export FORTIFYROOT_API_KEY="fr_sk_..."
ocelle.init(app_name="my-llm-app")

@ocelle.tool(name="search_docs")
def search_docs(q: str) -> list[str]:
    ...

@ocelle.agent(name="researcher")
def research(question: str) -> str:
    # nested LLM + tool calls become structured agent / tool spans
    ...
# Full OpenTelemetry traces, metrics, and logs: queryable evidence
What you get
- OpenTelemetry-native traces, metrics, and logs
- Trace ↔ log ↔ metric correlation for every call
- Vendor-neutral OTLP export: no lock-in
- Queryable evidence for debugging and compliance review
- Per-attempt spans for retry loops
Make your GenAI predictable, safe, and auditable.
FortifyRoot is in early access. Request an invite, or get a free Cost & Safety Audit and we'll walk through it with you.